


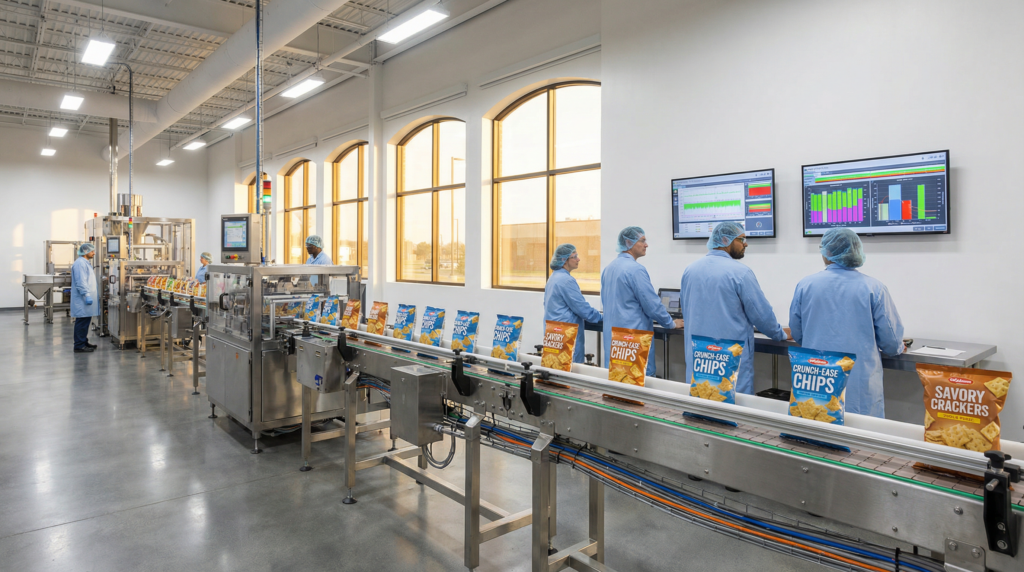
OEE Visibility That Drove a $2M Capacity Decision
Proficy OEE data gave a potato chip manufacturer the confidence to invest in a new line — because they could finally prove where the constraint actually was.
A plant running hard — but nobody knew how hard
This scenario represents outcomes typical of our Proficy OEE engagements in snack food manufacturing. This regional snack food producer had been running three kettle chip lines at what every supervisor described as “near capacity.” Demand was outpacing output, and the operations director had a decision to make: invest $2 million in a fourth line, or find a way to squeeze more out of the existing three.
The problem was, the data didn’t exist to answer that question honestly. Downtime was tracked in spreadsheets — when it was tracked at all. Shift supervisors had their own definitions of “a good run.” The maintenance team was chasing fires without any visibility into whether those fires were getting worse or better. Corporate was asking for OEE numbers, and the plant was producing estimates.
The operations director’s words in the first meeting: “We think Line 2 is our bottleneck, but we’re not certain. And I’m not going to ask the board for $2 million based on a hunch.”
Line OEE — Baseline vs. Post-Implementation
Connect the equipment. Let the data speak.
Rain Engineering’s first task was getting clean, real-time data from the floor into Proficy Plant Applications. The three lines ran a mix of older Allen-Bradley PLCs and a newer Siemens S7 installation — all of which needed to be talking to Proficy’s OEE module consistently before any analysis could begin.
We also spent time at the beginning of the engagement doing something that often gets skipped: agreeing on definitions. What counts as an unplanned stop? How long does a slowdown have to last before it’s logged? What’s the standard batch size for each SKU? Without these agreements in place, OEE numbers mean different things to different people — and they can’t be trended over time.
Within two weeks of go-live, the data told a story that surprised even the supervisors who had been on Line 2 for years: availability was the problem, not throughput rate. The line wasn’t running slow — it was stopping too often, and the stops were concentrated around one specific piece of equipment.
“We didn’t buy a fourth line because we guessed we needed it. We bought it because Proficy showed us, with 90 days of data, that we’d already found every efficiency gain available — and demand still outpaced us.”
Operations Director · Regional Snack Food Manufacturer · Southeastern U.S.
What 90 days of honest data delivered
The honest part of the story
The technology was the easy part. Proficy Plant Applications is a mature, capable platform — it does what it’s designed to do when it’s configured correctly. What made this engagement different was the time we spent before the first tag was mapped.
Getting operations, maintenance, and quality in the same room to agree on what “availability” means — before anyone sees a dashboard — is the work that most implementations skip. When those definitions are missing, you end up with OEE numbers that supervisors argue about instead of act on.
The other factor was patience with the data. The operations director gave the system 90 days before drawing any capital conclusions. That discipline — not reacting to the first week of numbers — is what produced a defensible, trend-backed story for the board. Proficy gave them the data. They gave themselves the time to let it mean something. This scenario represents outcomes typical of our Proficy OEE engagements in snack food manufacturing.

Is your OEE data telling you the truth?
We do a free, no-obligation Proficy readiness assessment for snack food manufacturers. 90 minutes with your ops team. You leave knowing exactly where your data gaps are.